What is Transformative?
Transformative is a compliance intelligence platform. It connects to the databases, form systems, and telematics platforms your organisation already uses — and gives you a single place to see, question, and act on all of that data together.
Think of it as the layer that sits above your existing systems. Your route data lives in SQL Server. Your field forms come in via DoForms. Your vehicle GPS streams through Geotab. Transformative ingests all of it, stores a complete bi-temporal history, and puts a powerful analytical interface on top.
You don't need to change anything about how you operate. The platform reads your data as it already exists, tracks every change over time, and lets you interrogate what happened, when it happened, and what's likely to happen next.
Your Dashboard
When you log in, you land on your data source dashboard. Each connected data source appears as a named panel — your fleet management system, your forms data, your telematics feed. Select one to open it.
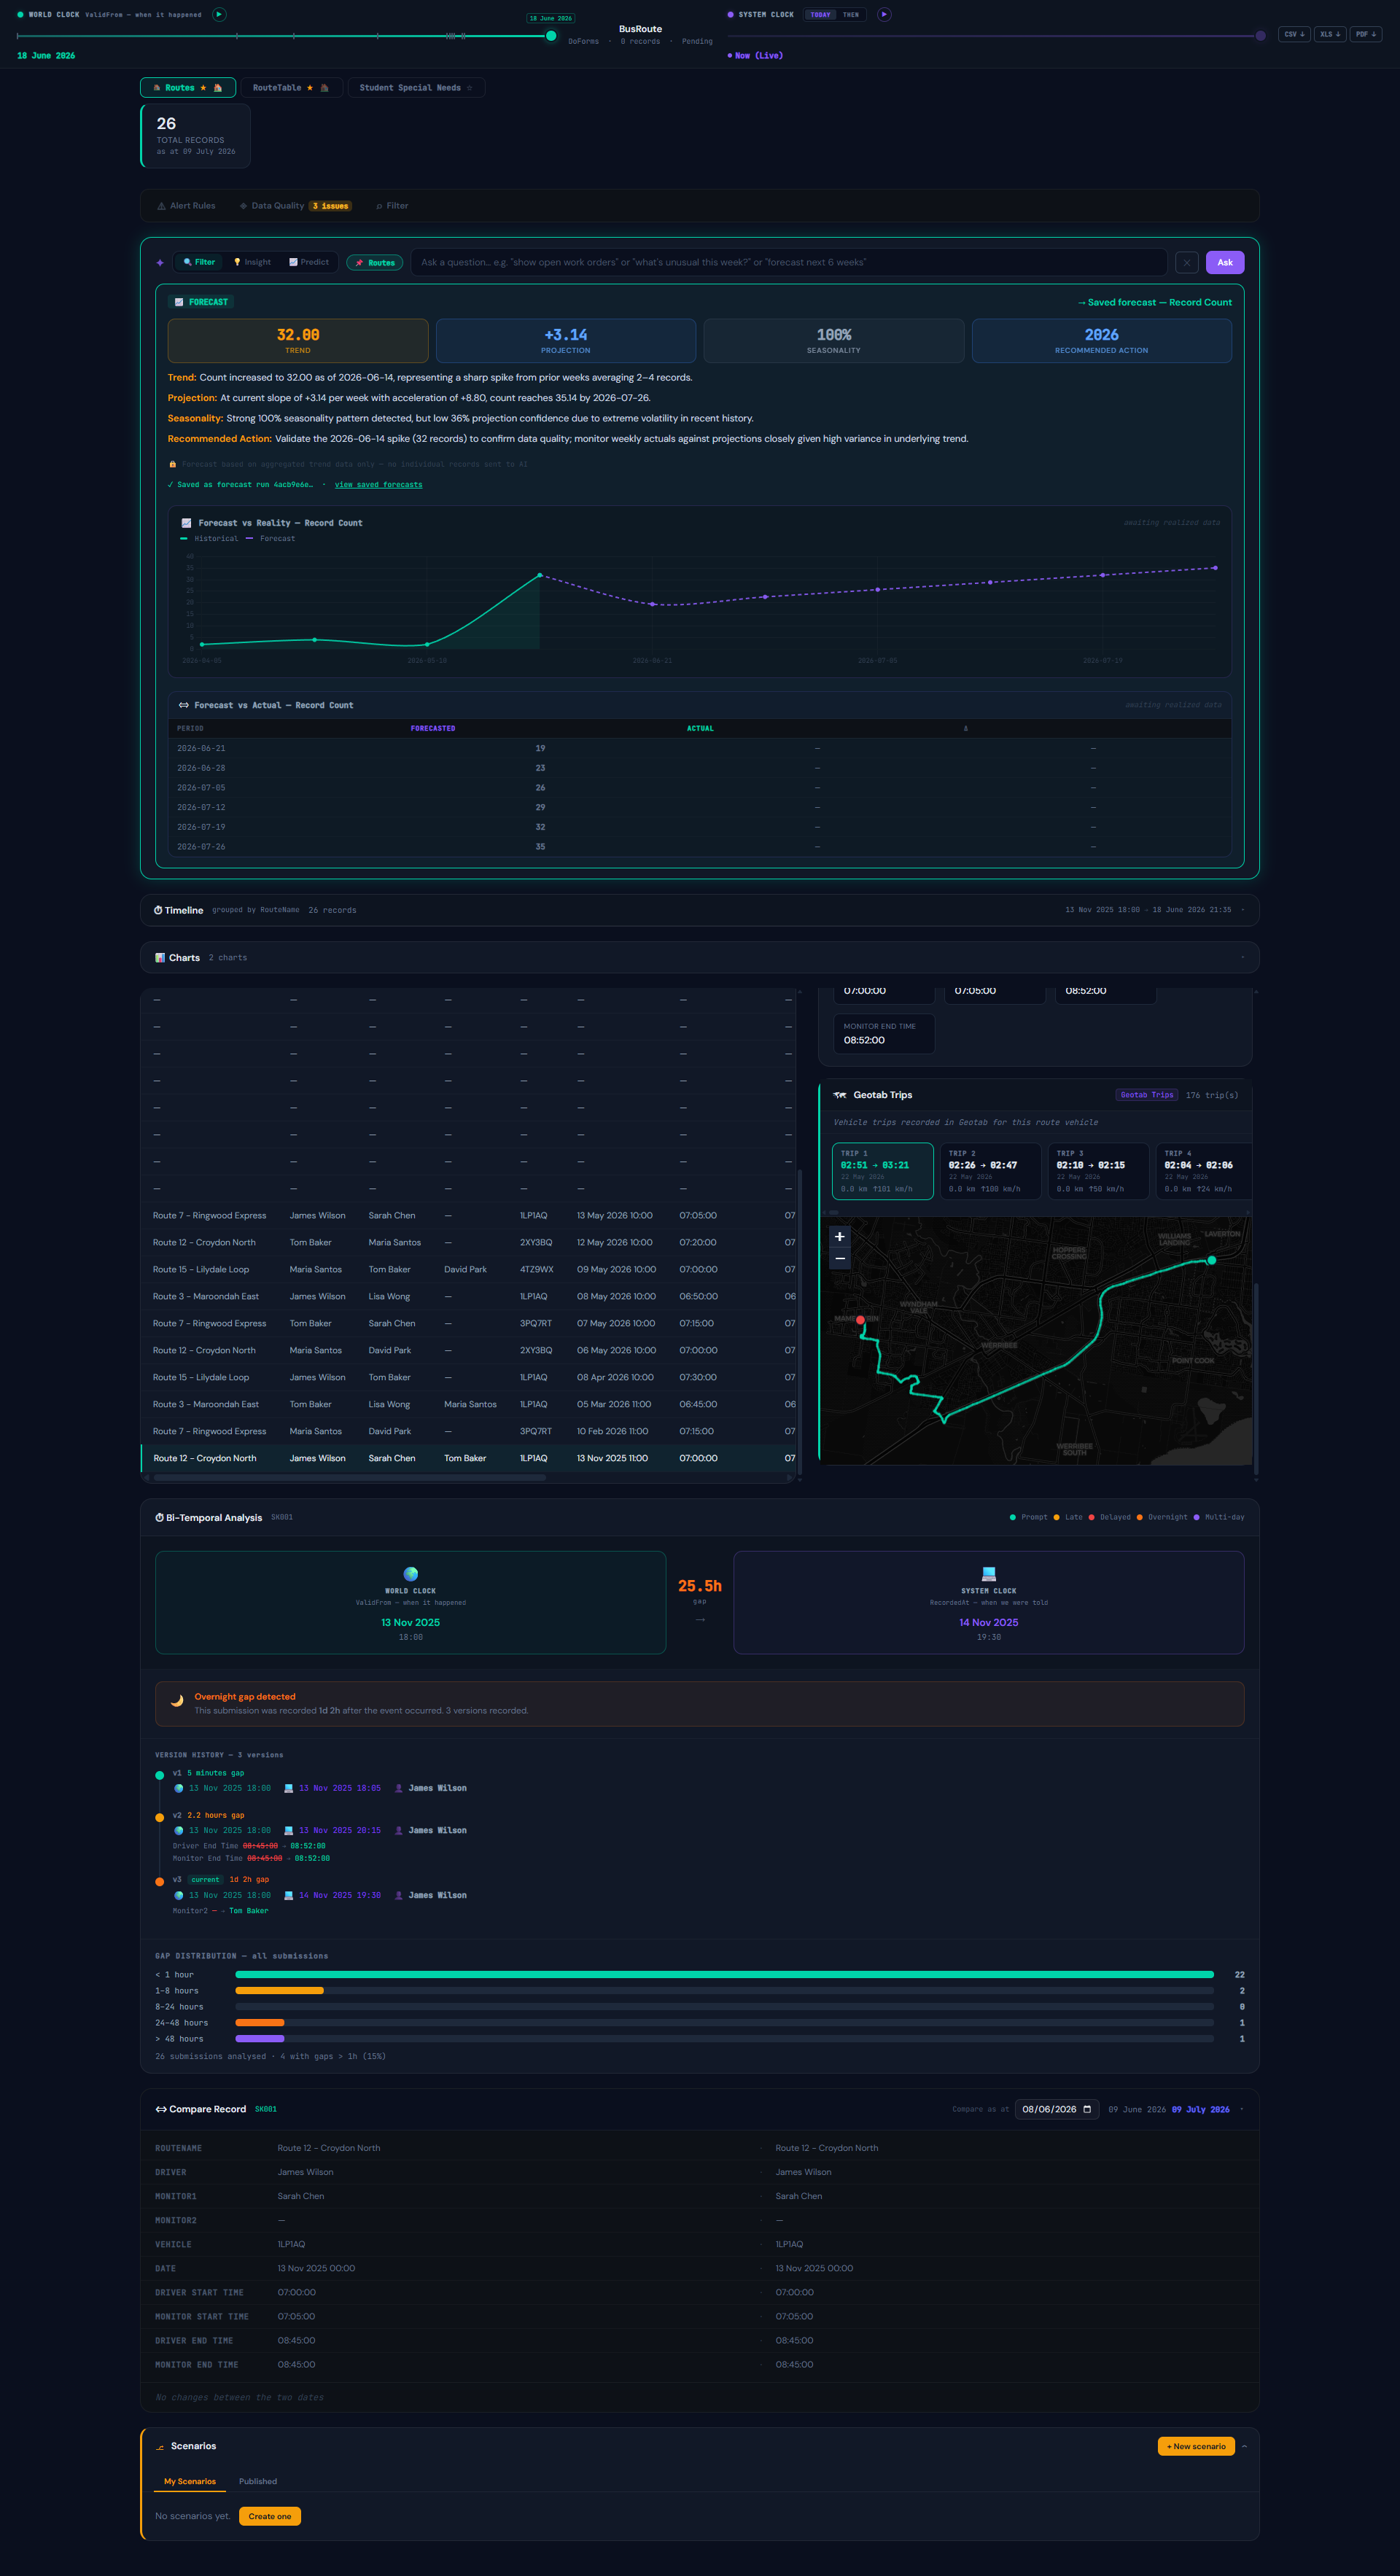
Once inside a data source, the interface divides into three areas:
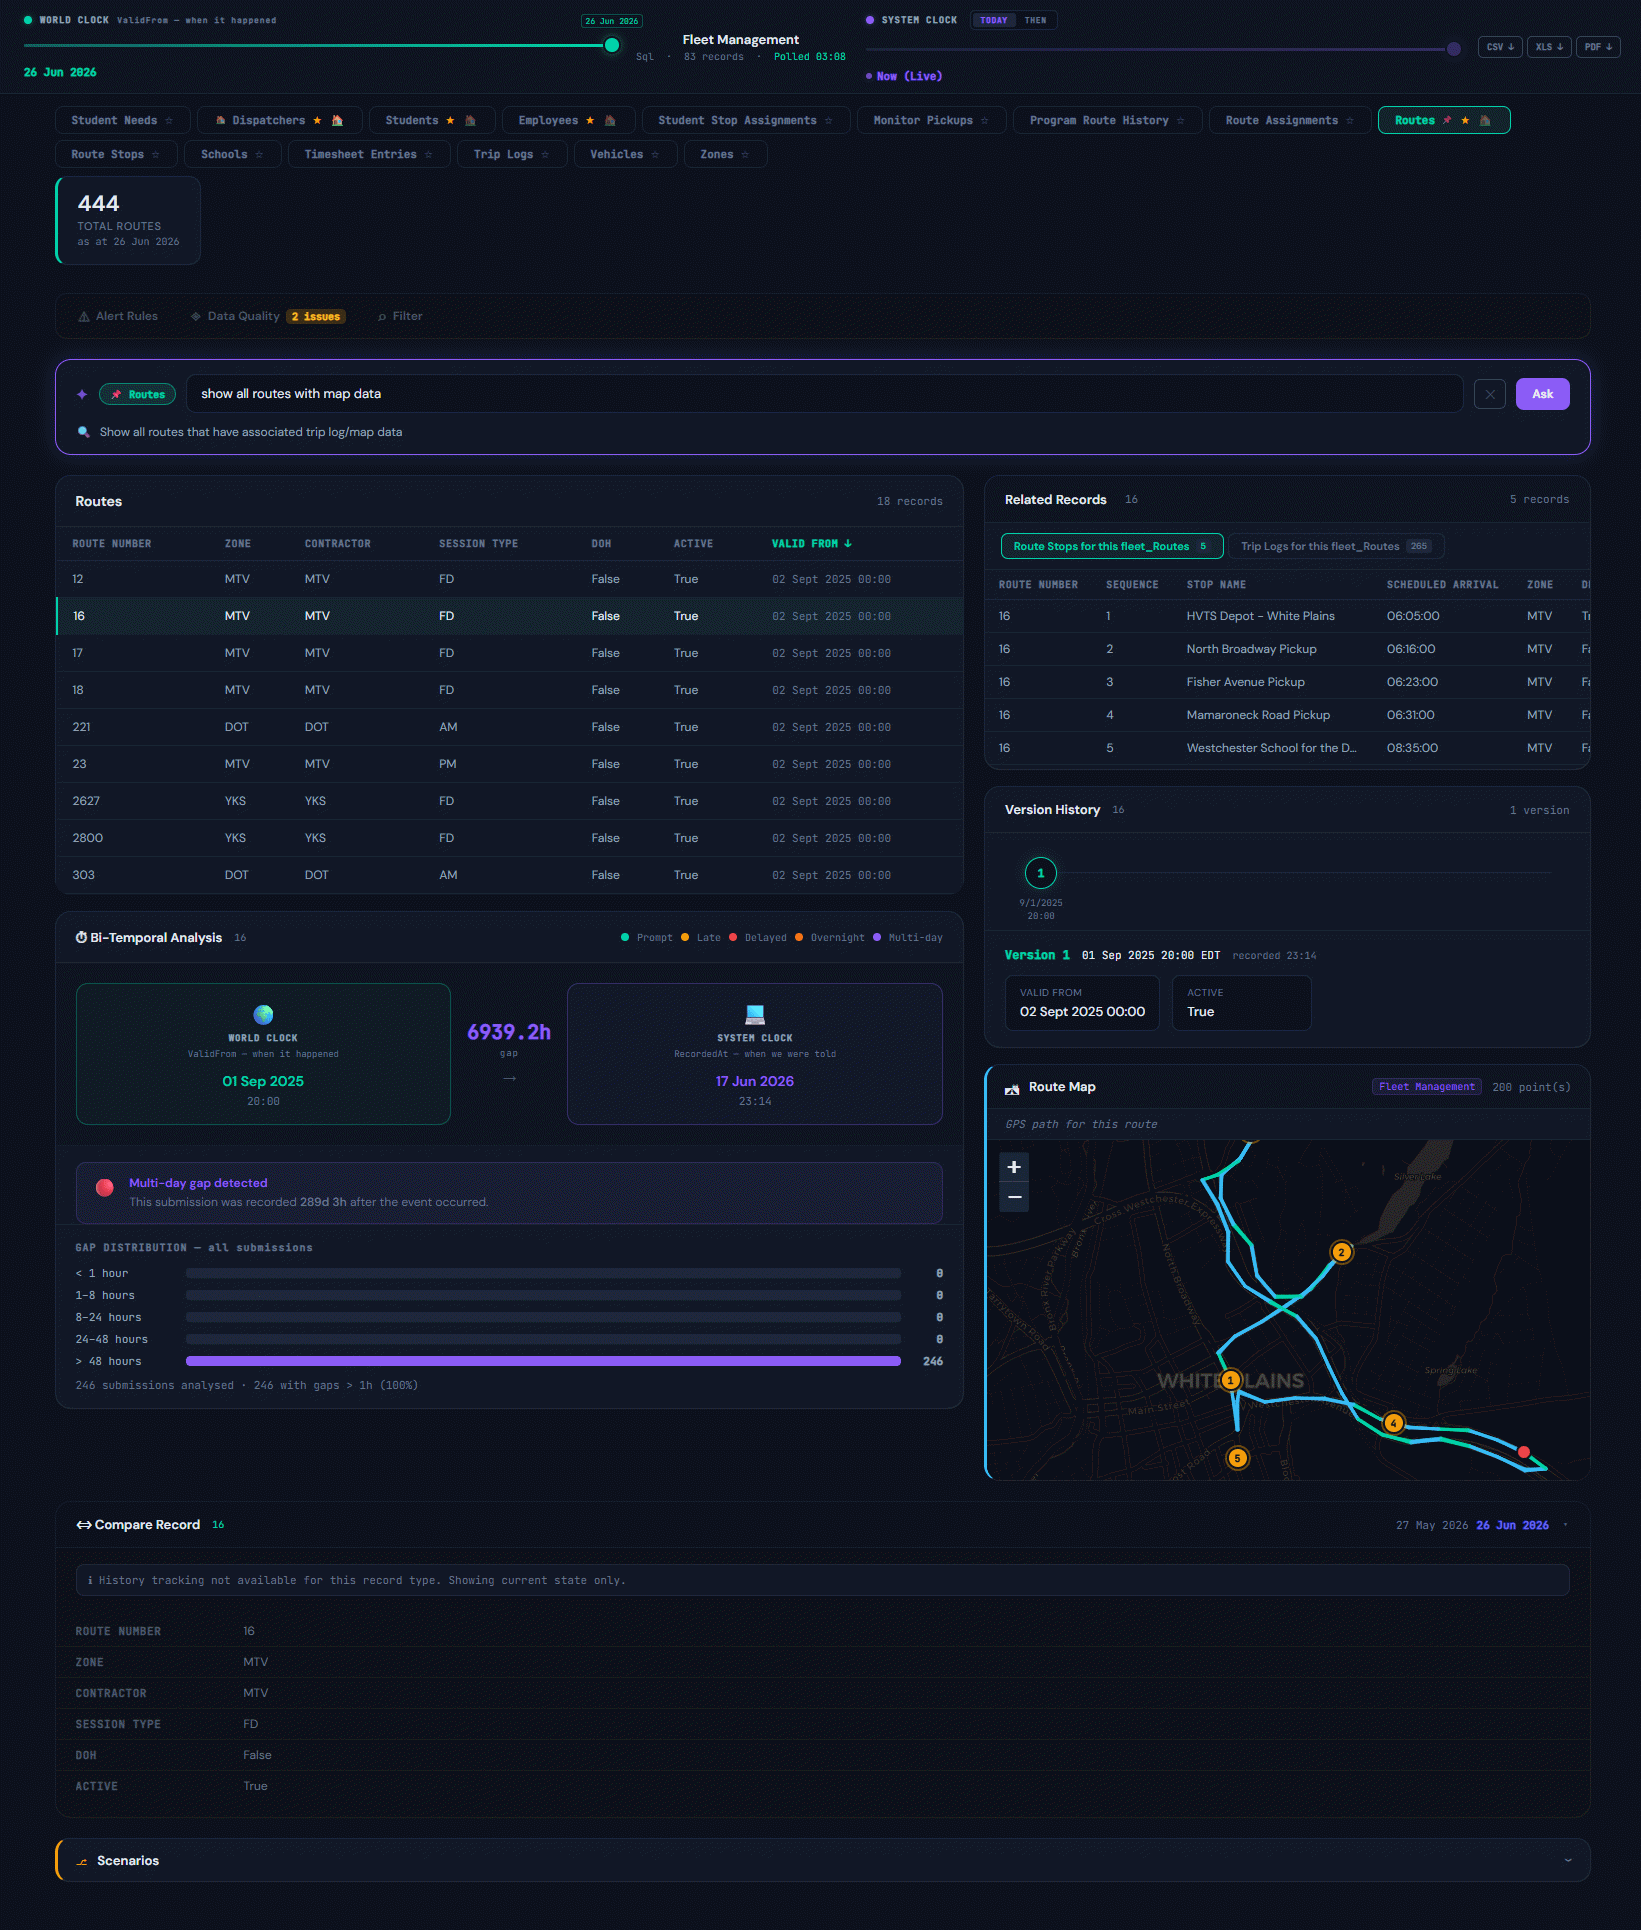
Exploring Your Data
Records in the main grid represent the current state of each entity. Clicking a record reveals everything attached to it — not just the fields, but the full connected graph.
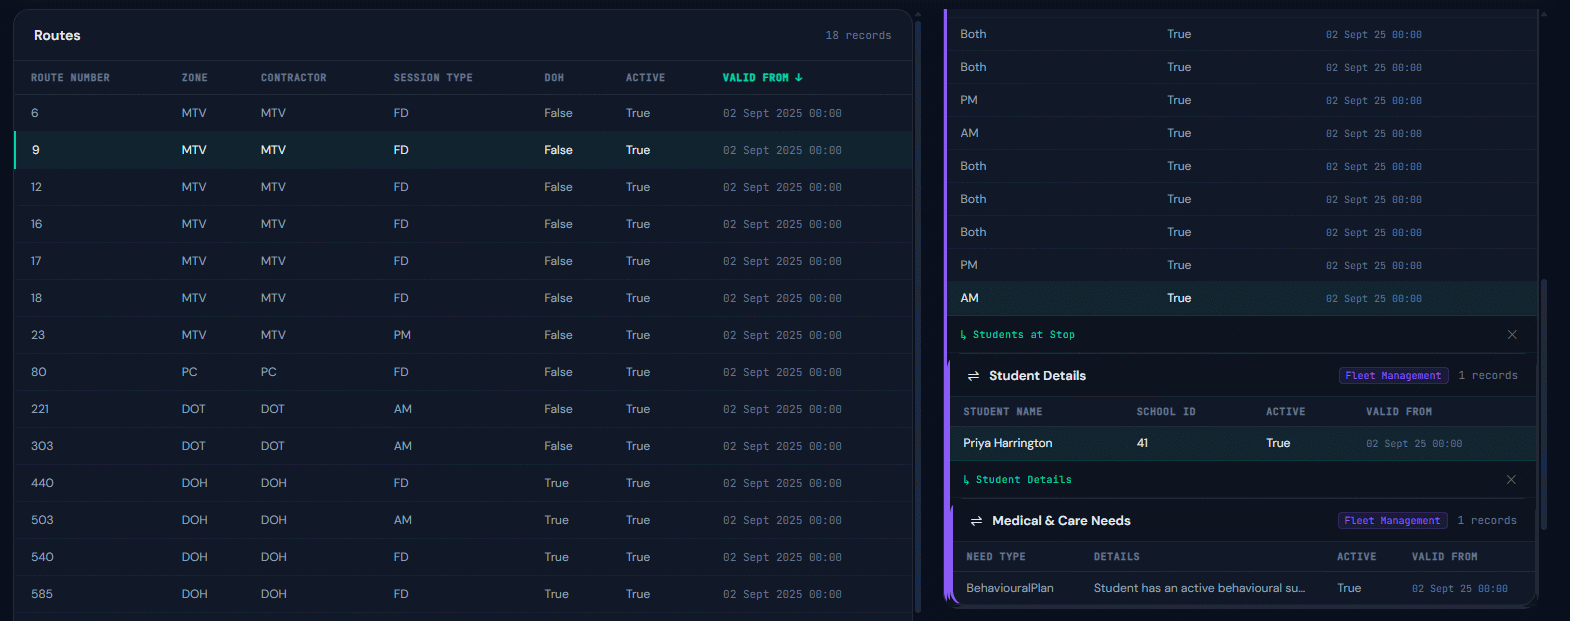
Drill-Down Navigation
For data with natural parent-child relationships — routes containing stops, stops with students assigned — the right panel shows a linked hierarchy. Click through from a route to see its stops. From a stop, see which students board there. From a student, see their care needs and medical requirements. Each level loads the next without leaving the page.
The Toolbar
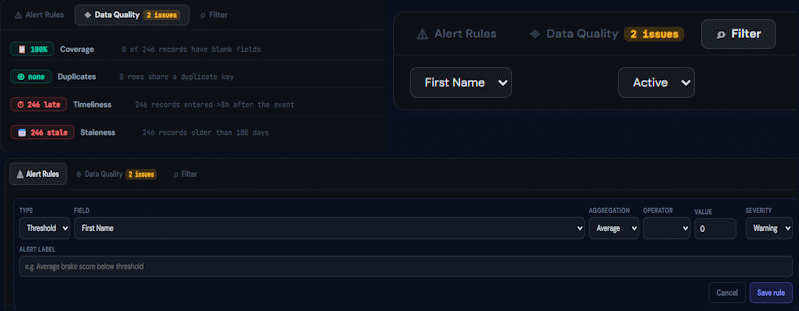
Above the main grid, a compact toolbar gives you three controls that work together:
| Control | What it does |
|---|---|
| Alert Rules | Define threshold rules that fire when a field value crosses a limit — average speed below threshold, record count above expected. Active alerts show a count badge. |
| Data Quality | Runs four automatic checks: field coverage, duplicate detection, timeliness, and data staleness. Flags issues without you having to look for them. |
| Filter | Apply one or more field filters to narrow the grid. Works alongside AI queries — you can combine both. |
Asking Questions in Plain English
The AI query bar sits between the toolbar and the data grid. It's the most powerful way to work with your data — type a question or instruction in plain English and the platform figures out exactly what to query, which table to look in, and how to surface the result.
There are three distinct modes. You switch between them using the mode selector on the left of the bar.

"show active vehicles assigned to the Yonkers district"
"show students with an EpiPen requirement"
— The grid narrows to exactly those records. No SQL required.
"which routes have the highest timesheet variance?"
"summarise vehicle utilisation across the fleet"
— Returns a narrative summary with the underlying figures.
"predict timesheet hours over the next month"
— Generates and stores a forecast run you can monitor over time.

Maps and GPS Intelligence
For data sources with geospatial content — vehicle GPS, route stop coordinates, trip logs — Transformative renders an interactive map directly in the right panel when you select a record. No configuration needed; the platform reads latitude, longitude, and sequence information from the registry and draws the map automatically.
Route Maps
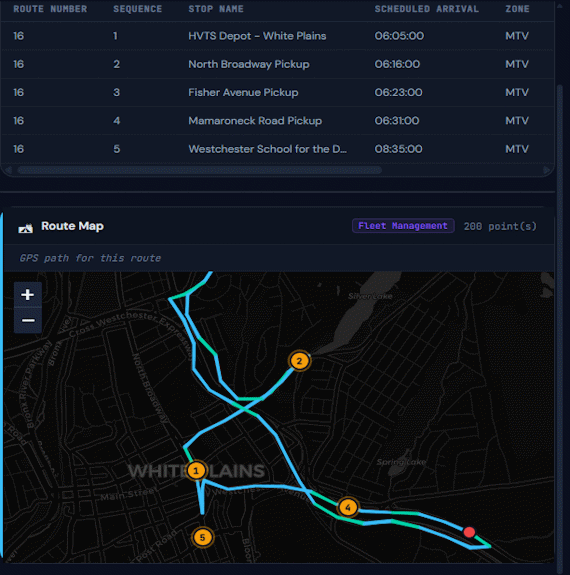
Select a route record and the map draws the actual GPS breadcrumb trail for that route — the path vehicles travelled, timestamped at the intervals your telematics system captured. The track is drawn in time order so you can see exactly how the journey unfolded.
Stop Markers
Where a route has planned stop data registered, numbered amber markers are overlaid on the GPS track — each marker showing the stop sequence number and stop name on hover. This lets you compare the planned stop sequence against the actual path travelled at a glance.
Geotab Trip View
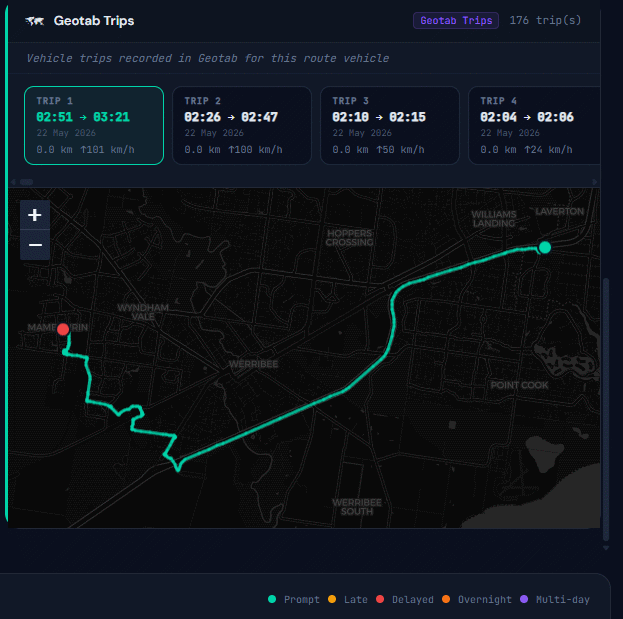
For Geotab-connected data sources, selecting a vehicle record shows a trip strip — each trip card displaying start time, end time, distance, and maximum speed. Click any trip card to isolate its GPS track on the map. This lets you drill into a specific journey without losing the context of the full day's activity.
Viewing Your Data at Any Point in Time
One of the most distinctive things about Transformative is that it never overwrites historical data. Every time a record changes in your source system — a route is reassigned, a vehicle changes status, a timesheet is amended — the platform stores both the new version and the old one, with a precise timestamp for each.
This means you can see your operation not just as it is today, but exactly as it was on any date in the past.
The Time Scrubber
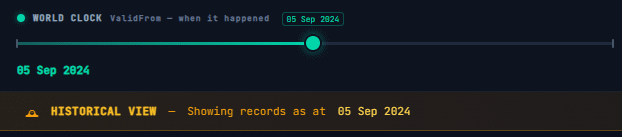
At the top of each data source view, a date/time control lets you set the "as at" date. Move it to last Tuesday and every table, every grid, every record refreshes to show the state of your data as it existed on that day. The header shows a persistent amber banner reminding you you're viewing historical state, with a "Return to Present" button.
Version History
Selecting a record and opening the Version History panel shows every version of that record across time — each change listed with its timestamp and the values that changed. This is your complete audit trail, available for every record, with no extra configuration.
Bi-Temporal Gap Detection
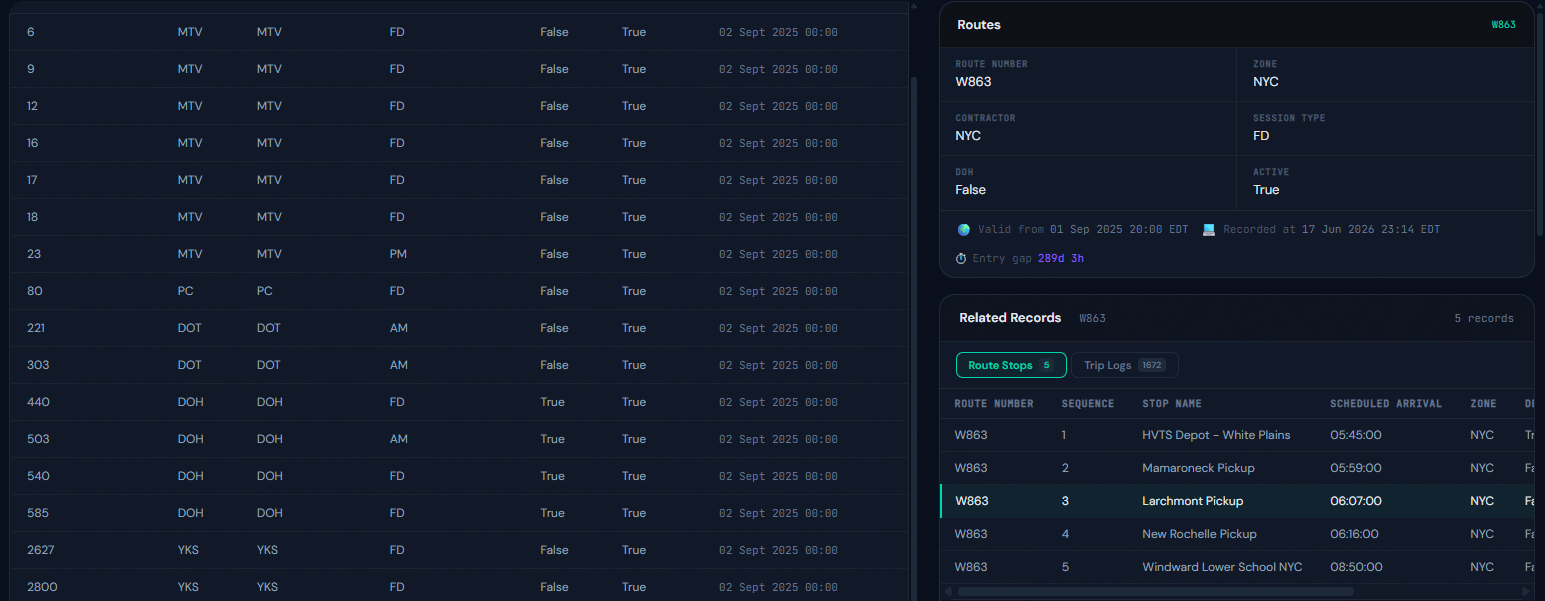
Transformative tracks two time dimensions for every record: when it was true in the real world (application time) and when the platform recorded it (system time). When these are significantly different — meaning data arrived late — the gap detection panel flags it. This is particularly useful for compliance: if a record needed to exist on a certain date but was only entered later, the gap is visible and measurable.
Forecasting and Divergence Alerts
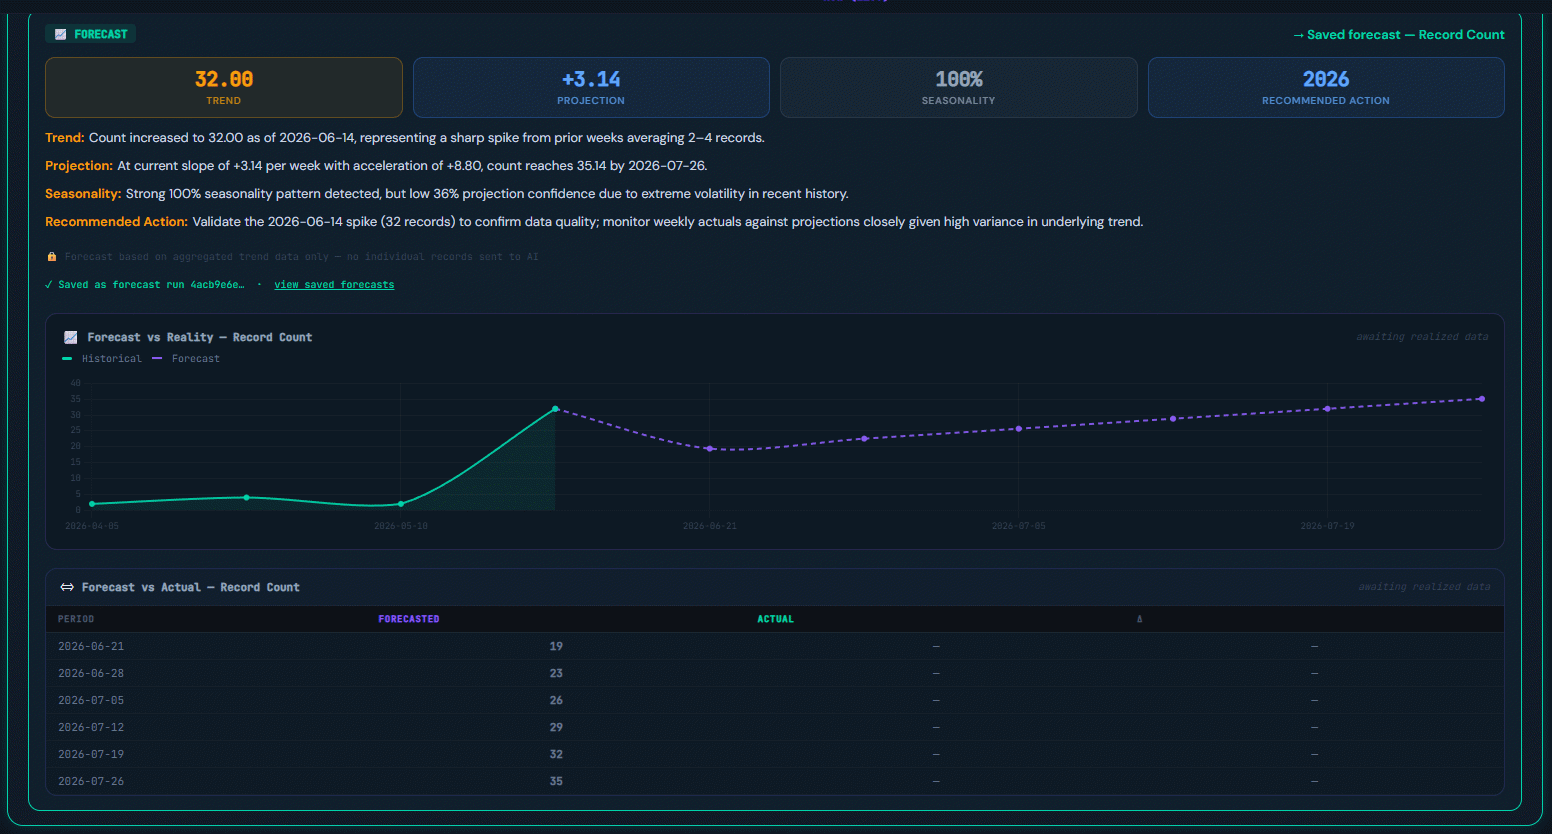
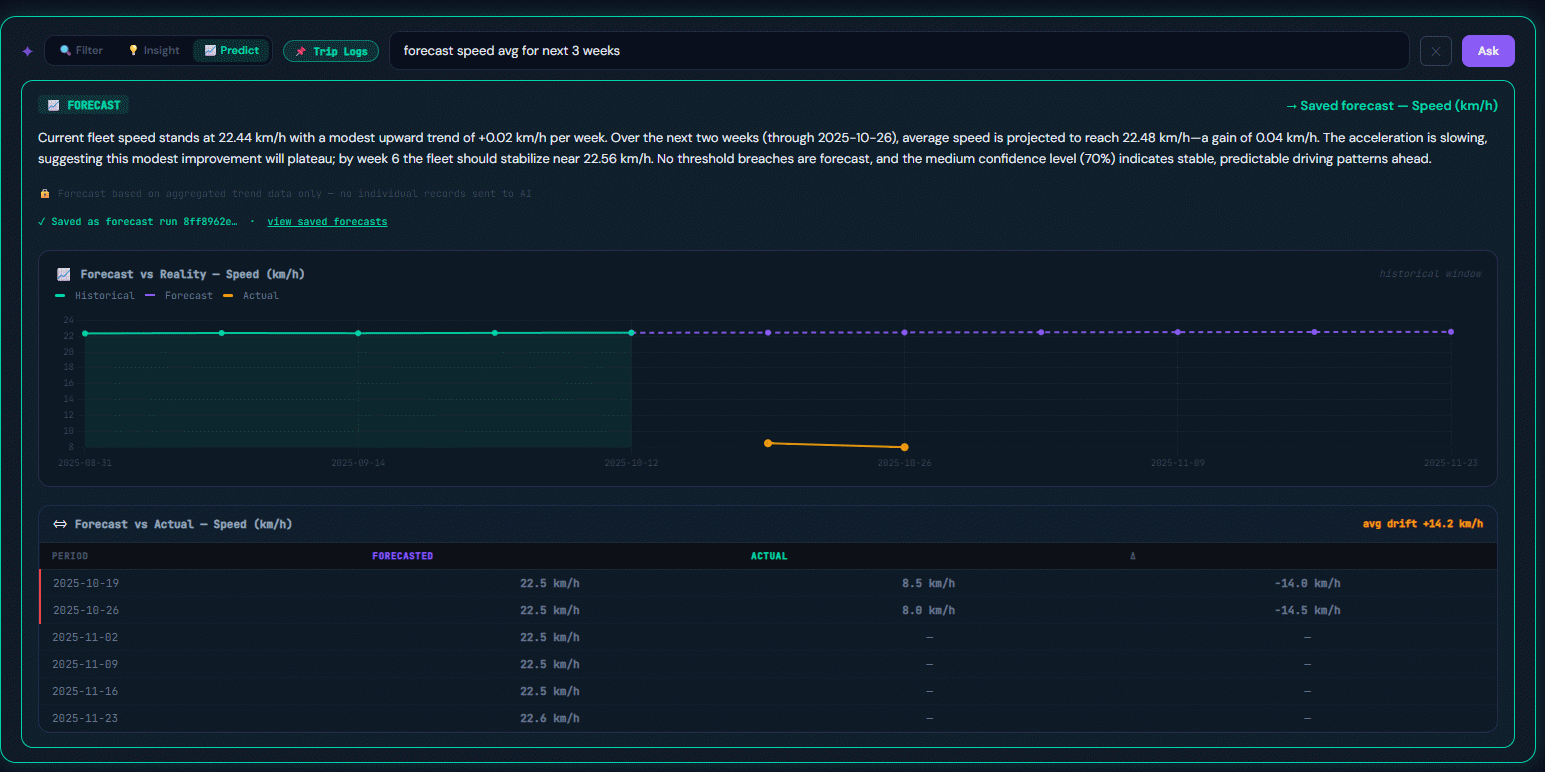
The Predict mode in the AI bar doesn't just show you what happened — it projects what's likely to happen next, based on the historical patterns in your data. And once a forecast is running, the platform monitors incoming actuals and alerts you if reality starts to diverge from the projection.
Running a Forecast
Switch the AI bar to Predict mode and type what you want to forecast. The platform identifies the relevant metric, analyses the historical trend, and generates a weekly projection for the period you specify. The forecast is stored against your tenant so you can return to it later.
What-If Scenarios
Scenarios let you model a proposed change to your operation and see what the data would look like if that change had happened — without touching the live record. You're creating a branch of reality that exists alongside your actual data, not instead of it.
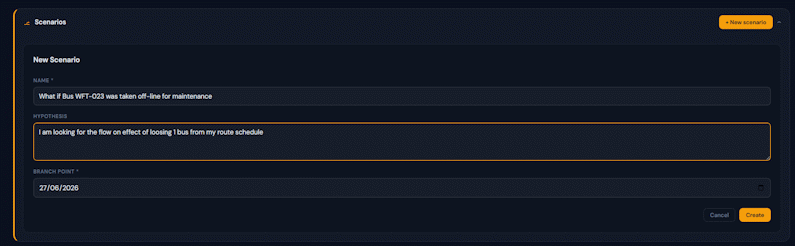
A scenario has a branch point — the date from which the hypothetical diverges from history. Everything before the branch point is your real operational data. Everything after is the modelled version.
Creating a Scenario
From the Scenario panel (below the main data grid), create a new scenario and give it a name and hypothesis. Then make the proposed changes — reassigning a route, adding a vehicle, moving a resource. The scenario tracks those changes as a separate set of records branching from your chosen date.
Private and Published
New scenarios are private by default — visible only to you. When you're ready to share the analysis with others in your organisation, you can publish it. Publishing is permanent: a published scenario becomes visible to all authenticated users on your tenant. It cannot be unpublished, which ensures the integrity of any analysis that others have reviewed or relied on.
What Feeds Transformative
Transformative is source-agnostic. It connects to the systems your organisation already runs. The provisioning of a new data source is handled by your platform administrator or reseller — as an end user, you see the data after it's been connected and ingested. This section is a brief overview of the types of sources the platform supports.
| Source Type | Description | Typical Data |
|---|---|---|
| SQL Server | Direct connection to any Microsoft SQL Server database. The primary ingestion path — if your operational system runs on SQL Server, it can be connected with no changes to the source. | Routes, vehicles, employees, timesheets, assignments — any operational table. |
| DoForms | Pulls submitted form records from the DoForms REST API. Ingests form submissions as bi-temporal records with full version history. | Field inspections, compliance checklists, maintenance reports, driver declarations. |
| Geotab | Connects to the Geotab telematics API. Ingests trip summaries and GPS log records for map and speed analysis. | Vehicle trips, GPS breadcrumbs, speed profiles, device exceptions. |
| OpenAPI / REST | Any REST API that exposes an OpenAPI 3.x specification can be connected as a data source with watermark-based incremental polling. | Third-party compliance systems, scheduling platforms, external registries. |
How Your Data Is Protected
Transformative is built for regulated industries where personal data carries legal weight. The platform supports GDPR Article 17 (Right to Erasure) and CCPA Right to Delete requirements through a cryptographic approach that is fully compatible with its immutable, bi-temporal data store.
How PII Fields Are Encrypted
When your administrator connects a data source, they can mark individual fields as containing personal information during the field mapping step. Each marked field is assigned a PII category:
| Category | Typical fields |
|---|---|
| Identity | Full name, date of birth, national ID, employee code |
| Medical | Health conditions, care needs, medical notes, medications |
| Financial | Salary, pay rates, cost codes, billing references |
| Contact | Address, phone number, email, emergency contacts |
Once marked, the raw value of that field is never stored in plain text. Instead, the platform encrypts it with a unique AES-256 key generated specifically for that individual before writing the record into the database. The encrypted value can only be read back by the platform while that key exists. When you view a record in the platform, the decryption is automatic and invisible to you — the field appears exactly as it would otherwise.
The Right to Be Forgotten
When a data subject requests erasure under GDPR Article 17 or CCPA, your administrator processes the request through the Erasure Management section of the Authority. The process works in two stages to protect against accidental or mistaken erasures:
What Happens to Historical Records
The platform's bi-temporal records are never deleted. After a hard purge, the rows still exist in the database — you can see that a student was on a route, that a care recipient had a schedule, that an employee had shifts. The count, the dates, the relationships between records are all intact. Only the personal content of encrypted fields is gone.
In the platform UI, erased fields display as [Data Erased] rather than a blank, making it clear that the value existed but has been legally removed rather than that it was simply empty.
Blocked Re-Introduction
Once an erasure is scheduled (even during the grace period), the platform immediately blocks any attempt to re-ingest data for that individual from a source system. If the source system still holds the record and a poll cycle runs, the row is silently rejected and logged. This log is available to your administrator as proof that re-introduction was actively prevented — relevant documentation for regulatory compliance.
Erasure History & Audit Trail
Every erasure request — scheduled, recovered, or completed — is recorded permanently in an immutable audit log. This log cannot be edited or deleted. It records who requested the erasure, the legal basis, any verification reference provided by the regulator, and when each stage completed. Your administrator can view the full history at any time from the Erasure Management page in the Authority.
Key Concepts
A short reference for the terms you'll encounter across the platform.
| Term | What it means |
|---|---|
| Bi-temporal | Two time dimensions tracked for every record: application time (when the event actually happened) and system time (when the platform recorded it). Enables both accurate history and late-arrival gap detection. |
| As At | The date/time you want to view your data from. Set to "now" for current state, or any past date to see historical state. Controlled by the time scrubber in the header. |
| Data Source | A connected external system — your SQL database, your DoForms account, your Geotab account. Each data source has its own set of tables, displayed as tabs. |
| Poll Cycle | The regular interval at which the platform queries your source system for new or updated records. New data typically appears in the platform within minutes of appearing in the source. |
| Forecast Run | A stored AI-generated projection for a specific metric. Each time you run a Predict query, a new forecast run is created and appears in the history list below the AI bar. |
| Divergence Alert | A rule attached to a forecast run that fires when realised actuals deviate from the forecast by more than a configured threshold percentage. Monitored automatically on every poll cycle. |
| Scenario | A hypothetical branch of your operational data, modelling a proposed change from a specific branch point date. Private until published. Publishing is permanent. |
| Compliance Tier | The subscription tier that determines which features are available: Compliance (data access and history), Scenario (adds what-if modelling), Predictive (adds AI forecasting and alerts). |
| ValidFrom | The application-time timestamp on every record — when the fact it describes was true in the real world. Used for all as-at queries and forecast comparisons. |
| UTC | All data is stored internally in Coordinated Universal Time. The platform converts to your local timezone for display, based on your account's display timezone setting. |
| PII | Personally Identifiable Information. Fields marked as PII by your administrator are encrypted at ingest with a unique per-subject key. They appear normally in the platform while the key exists, and display as [Data Erased] after a hard purge. |
| Crypto-Shredding | The erasure method used by the platform. Rather than deleting records, the encryption key for a subject is destroyed. Without the key, the encrypted personal fields are permanently unreadable noise — even though the rows remain intact in the immutable ledger. |
| Grace Period | The window between scheduling an erasure and the hard purge. Default 72 hours. During this period ingest is blocked but data is still readable. A super-administrator can recover the erasure if it was scheduled in error. |
| Hard Purge | The automatic, irreversible destruction of an encryption key once the grace period expires. Performed by the platform's background purge worker. After a hard purge, recovery is not possible. |
| Subject Reference | The internal identifier used to associate encrypted fields with their encryption key. Typically a stable ID column from the source system — such as a student ID or employee number. All tables sharing data about the same person use the same subject reference. |